

The chart you need is never quite standard
The analysis is finished, the numbers hold up, and the report still needs its figure. It is rarely a plain scatter plot: this one wants two y-axes, that one a log scale with a shaded band, the next one the department's colors. Matplotlib can do all of it. Finding the exact sequence of calls is the part nobody budgets time for.
So the figure gets postponed, or simplified until it no longer shows the thing it was supposed to show.
Describe the chart, then edit the code it returns
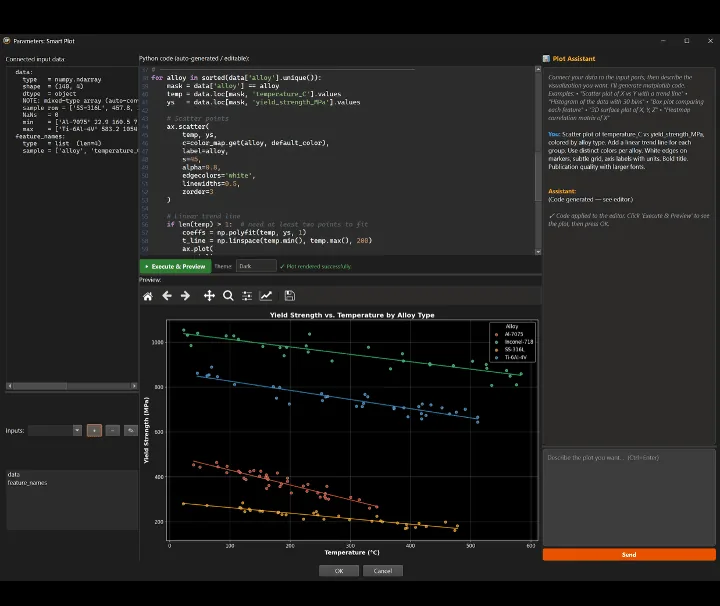
Smart Plot is one of the AI-assisted nodes in STOCHOS Flow. It writes plotting code, not predictions: you describe the figure, it generates matplotlib you can read, and the preview shows what that code produces. The built-in plot nodes cover the standard charts; Smart Plot exists for the one your report actually needs.
One plain-language line: which variables, which axes, what to highlight. You do not need to know the matplotlib call for any of it.
Smart Plot generates the matplotlib source and renders it beside the code. Both stay in view, so a wrong label or scale is a one-line fix.
The finished figure exports in the format the destination needs: PNG for the slide, SVG for the web, PDF for the paper.
Common questions
01Is Smart Plot a no-code plotting tool?
No. The generated matplotlib is shown in full and is meant to be read and edited like any script. The plain-language description gets you a working first version, not a black box.
02Does Smart Plot make predictions?
No. It generates chart code. Predictions come from the DIM-GP models in the workflow; Smart Plot reads the results those models produce and draws them the way you asked.
03Do the AI-assisted nodes need a cloud connection?
No. STOCHOS Flow is local-first: the assistant can run on a local LLM via Ollama, with cloud models as an option if you want them. The core features work without AI agents at all.
STOCHOS Flow
The node-based workflow environment Smart Plot ships in. Local-first, with optional cloud LLMs.
STOCHOS
The predictive engine underneath: DIM-GP surrogate models with quantified uncertainty.
Predict a full field
How a surrogate model returns a whole field, not one scalar at a time.
News and Guides
Every guide and insight we have published, in one place.