


Why everything gets varied
Without a ranking, every input looks like it might matter, so the design grows to cover all of them and the budget spreads thin across parameters that do nothing. Adding a factor to a screening design is cheap on paper and expensive in the lab, and nobody wants to be the person who fixed the one variable that turned out to drive the result.
The outcome is a campaign that resolves nothing well. Each parameter gets a couple of levels, the important ones are sampled too coarsely to model, and the unimportant ones absorb runs that produce flat, uninformative data.
What a ranking actually tells you
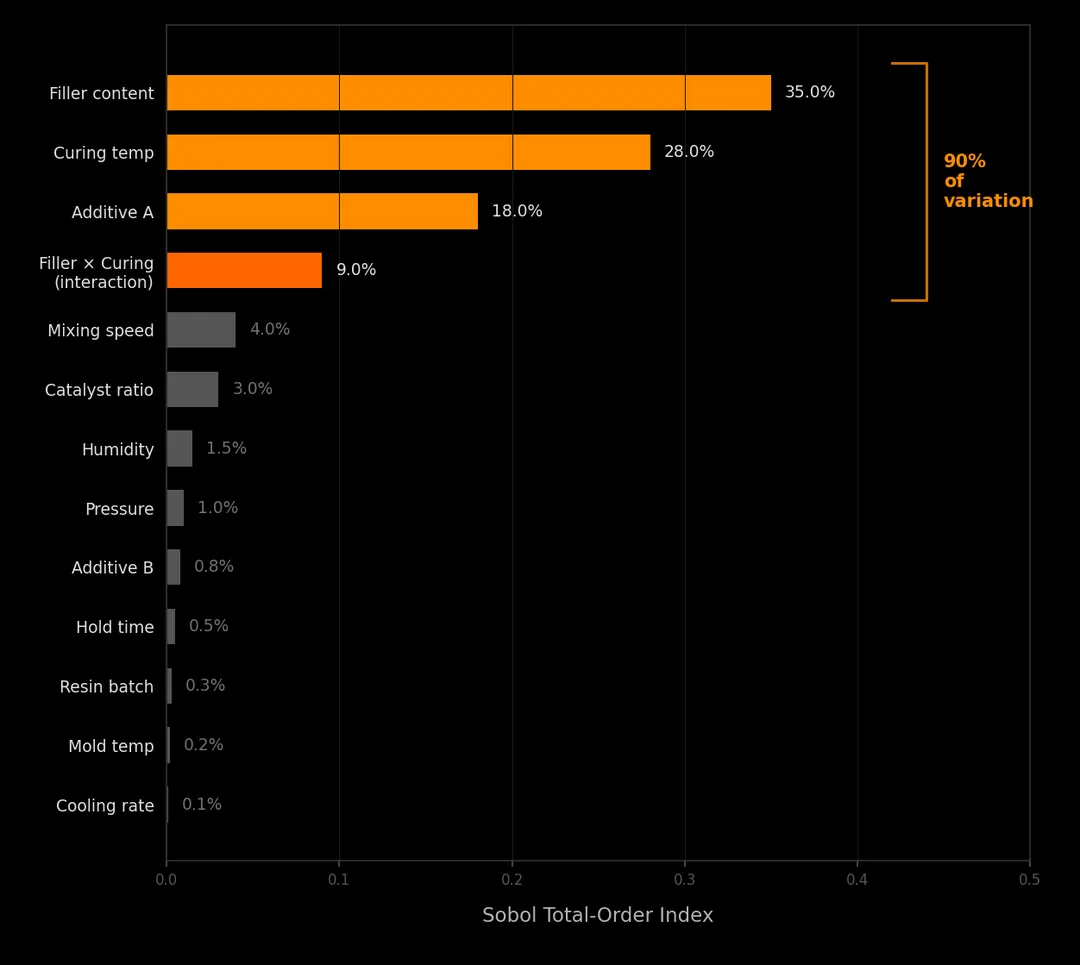
A sensitivity index reports the share of output variation attributable to each input, and separating the direct effect from the total effect shows which inputs matter only through their interactions. A large gap between the two for one input is the signal that it does nothing on its own and a great deal in combination.
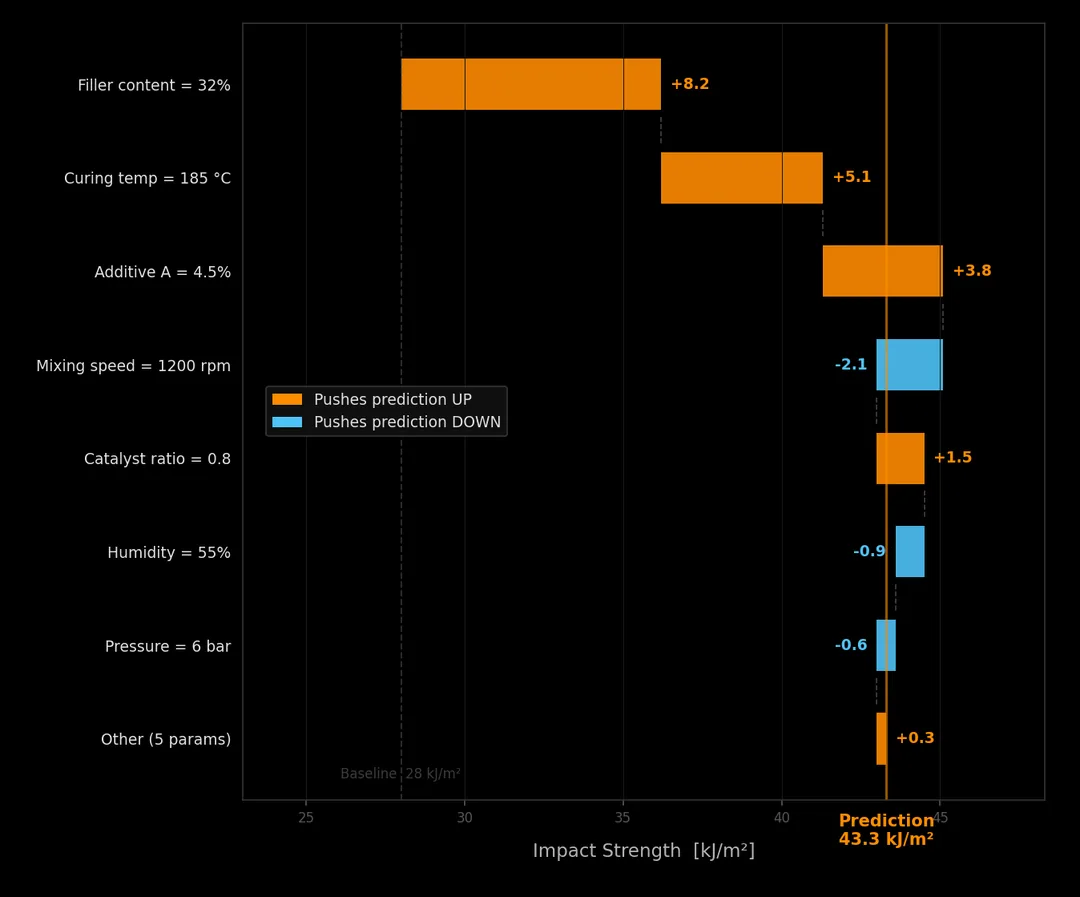
The global picture ranks drivers across the whole space you sampled. A local view answers a different question: why one specific batch or design came out where it did. Both are useful, and they are not substitutes, so it pays to be clear which one you are asking for. The sensitivity analysis page works through both views in more depth.
Choosing a method
Different questions need different measures, from correlation for a quick look through to variance-based indices when interactions matter, and six sensitivity methods are built in. Picking one is mostly a matter of how much structure you expect in the response and how many inputs you need to thin down.
Linear or monotonic association between an input and the result. The fastest first look, and the one that misses nonlinear effects.
Sobol indices split the variation of the result across inputs and their interactions. This is the family that gives you direct and total effects.
DGSM averages gradients across the space to rank many inputs cheaply. Useful when the parameter list is long and you want a first cut.
SHAP shares a single prediction out among the inputs that produced it. For one batch, one design, or one outlier you need to explain.
In practice you run more than one. A cheap ranking thins thirty inputs to eight, and a variance-based analysis then resolves the order among those eight and exposes the interactions the cheap method could not see.
Rank first, then design the campaign
Run it on data you already have, before the next campaign, so the ranking shapes the design rather than explaining it afterwards. The indices are computed on a surrogate model fitted to those results, which is what makes it affordable: no fresh runs are needed to produce the ranking itself.
What comes out is a decision about the next design. High-ranked inputs get more levels and a wider range. Low-ranked inputs get fixed at a sensible value and recorded, not deleted, so the assumption is visible when someone later widens the space. If you do widen a range, rerun the ranking, because it only holds over the region your data covers.
Common questions
01Do I need new experiments to run sensitivity analysis?
Usually not. It runs on the results you already have, and a surrogate model lets you compute indices without thousands of fresh runs.
02What if two inputs only matter together?
That is the interaction case, and it is why total-effect indices exist. An input with a small direct effect and a large total effect matters through its interactions.
03Can I just drop the low-ranked inputs?
Fix them, do not forget them. The ranking holds for the range you sampled, so an input that was flat over a narrow range may not stay flat outside it.
Sensitivity Analysis
The method page: global and local views, and what each one answers.
Surrogate Modeling
The model the indices are computed on, and how it is fitted.
AI for Engineering
Ranking drivers inside a CFD, FEM, and CAE workflow.
News and Guides
Everything else we have published, in one place.